Basement Risk Check scores all 116 metro Detroit communities and about 1,100 census-tract neighborhoods on relative basement-flood risk, the Basement Risk Index (0 to 100), built from U.S. Census housing data and the City of Detroit’s own 311 water-in-basement records. Suburban scores are modeled from housing age and are labeled modeled. Detroit’s score additionally blends more than 13,900 documented 311 water-in-basement reports. The full method and its limits are published at /methodology.
How to cite it
Data (CC BY 4.0): basementriskcheck.com/data
Dataset version: acs2024-r2 (U.S. Census ACS 2020-2024 5-year), generated 2026-09-05.
Use of the charts and data is free under Creative Commons Attribution 4.0. A link back to basementriskcheck.com is appreciated.
Three current story angles
1. The metro rescored on the newest Census data
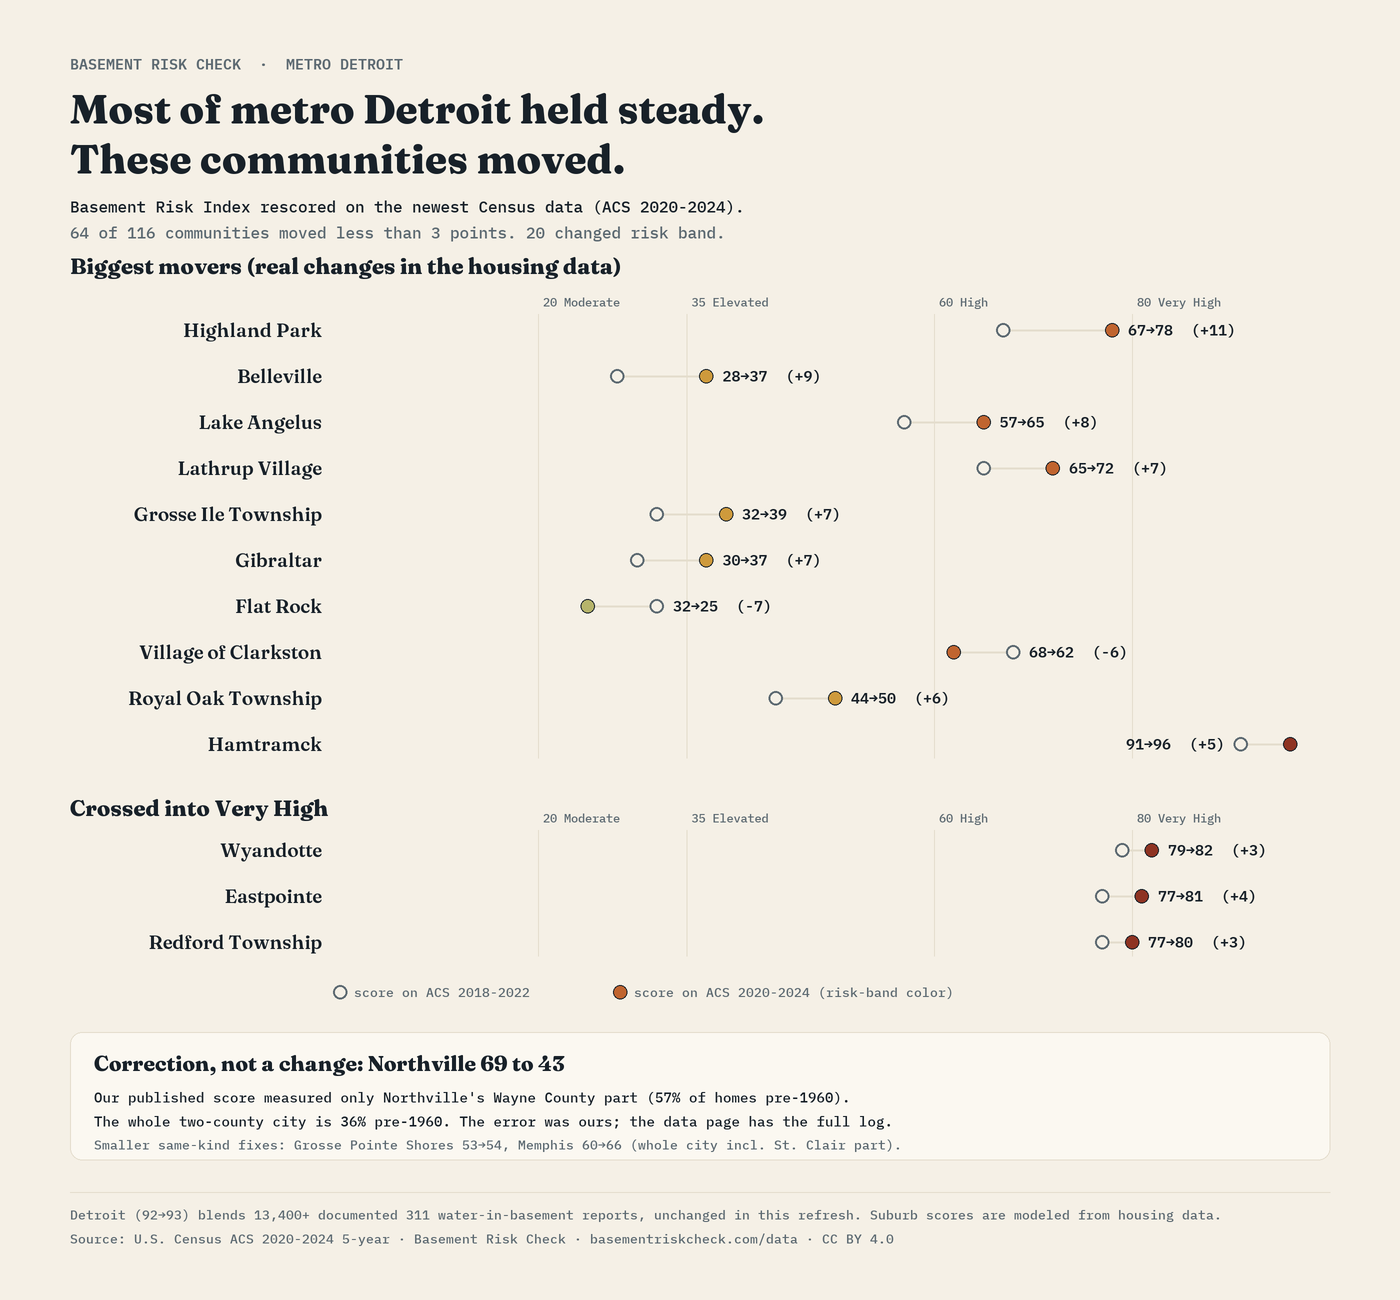
We reran the Index for all 116 communities on ACS 2020-2024 5-year estimates, the newest Census housing data, with the model unchanged. Most of the metro held steady, which is the honest headline: 64 of 116 communities moved less than 3 points. Twenty changed risk band. The genuine risers stand out, Highland Park to 78 and Belleville to 37, and Wyandotte (82), Eastpointe (81), and Redford Township (80) crossed into the top band. One published error was found and corrected in the open: Northville, which spans two counties, had been scored on its Wayne County part alone. Measured as the whole city it is 43, not 69.
Download: chart (PNG) · old-vs-new (CSV)
2. Who floods in Detroit, and why
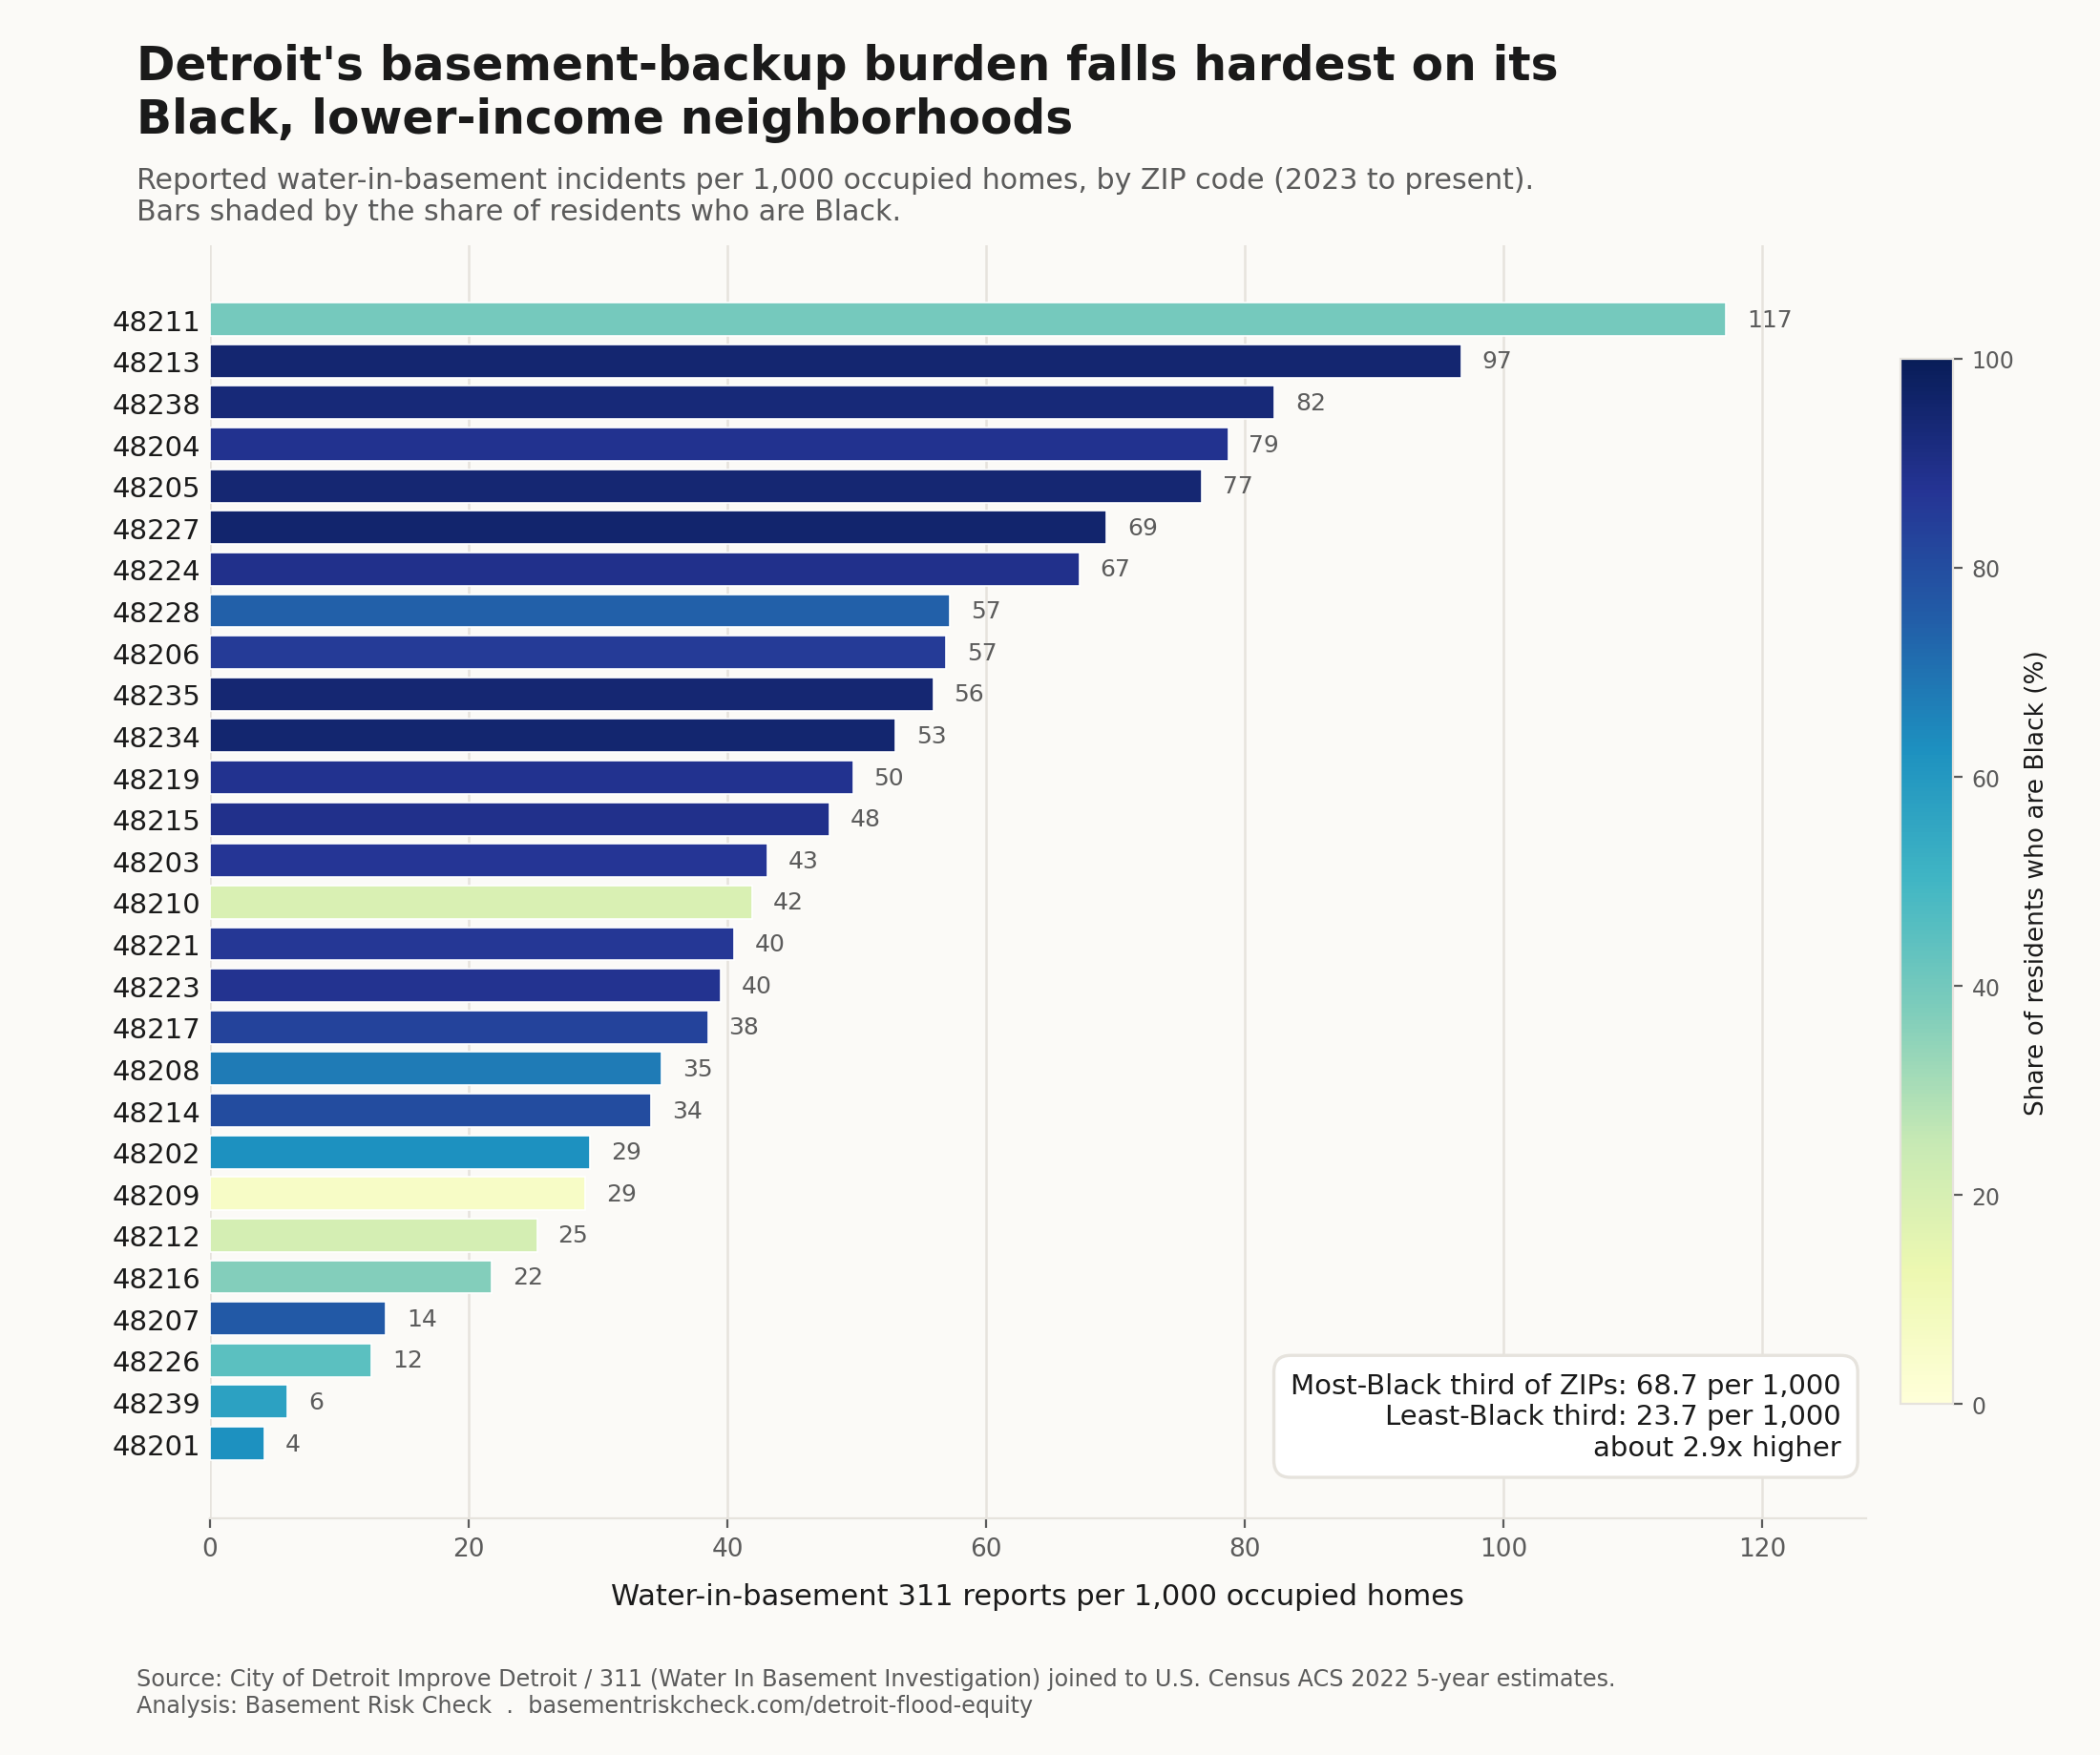
Joining the City’s 311 “Water In Basement Investigation” records to Census data across 28 Detroit ZIPs, basement backups are reported about 2.9 times more often in the most-Black third of ZIPs than the least (68.7 versus 23.7 reports per 1,000 occupied homes), and about 1.5 times more often in the lowest-income third than the highest. The mechanism is structural, not intent: old housing on aging combined sewers, concentrated by a century of redlining and disinvestment. Race and income track that history. They are not the cause of the water. 311 is complaint-based, so it partly reflects who reports.
Download: chart (PNG) · by-ZIP (CSV)
3. Old homes flood, money does not protect you
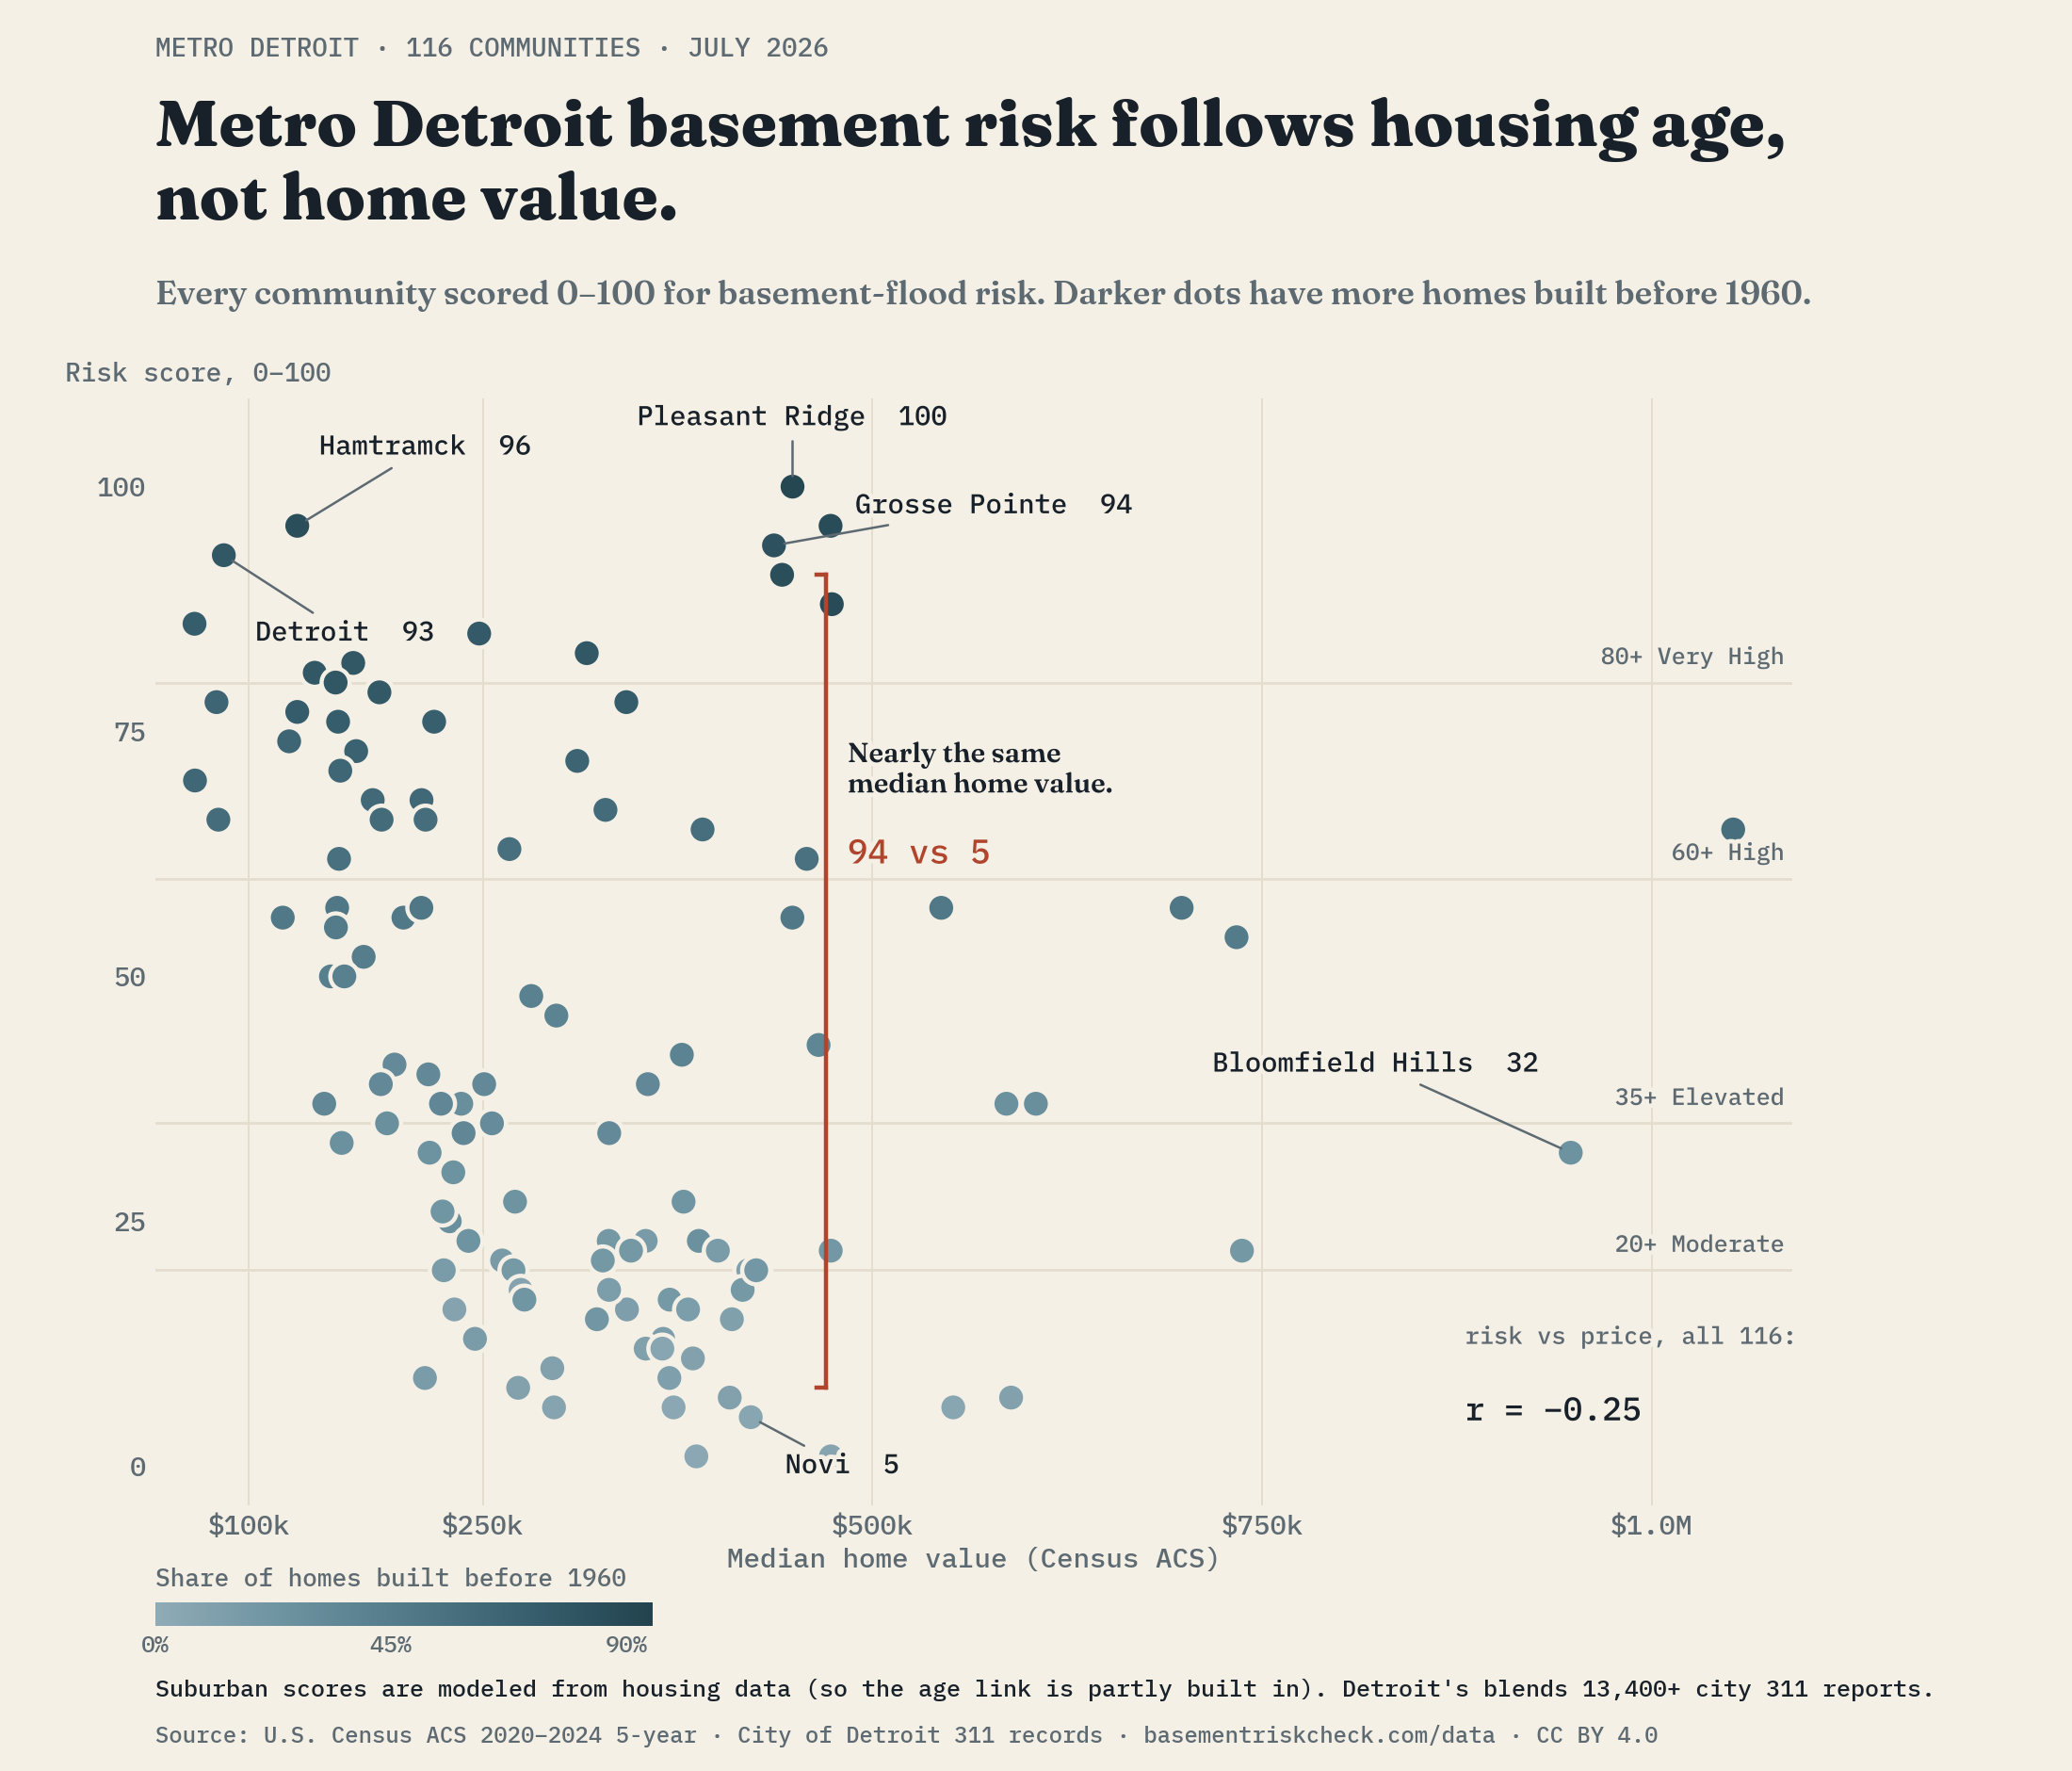
Outside Detroit the driver is housing age, not wealth. Grosse Pointe scores 94/100 and Novi 5/100, despite comparable Census median home values ($436,800 versus $421,900). Old homes on old drainage flood, and a high home value does not buy a dry basement. Detroit, at 93/100, is the one community whose score also carries observed flood records rather than a housing-age model alone.
Download: chart (PNG) · full index (CSV)
More to download
Download: map (PNG)
The complete open datasets, dictionary, and citation are at /data.
Limitations to state
- Suburban scores are modeled from Census housing age and are labeled modeled, and they are not observations of flooding.
- The Index is community and neighborhood level, not property level. It does not score an individual address.
- Only Detroit’s score integrates observed flood records (311, 2023 to present). Those records capture chronic backups, not the June 2021 disaster, which predates the current system.
Method, in one paragraph
Flood measure: City of Detroit Improve Detroit / 311 water-in-basement reports, 2023 to present (more than 13,900 citywide as of September 2026), counted by ZIP or neighborhood. Demographics: U.S. Census ACS. Community scores are modeled from Census housing age, weighted mainly on the pre-1960 share, min-max normalized across the 116 and rescaled 0 to 100. The metro median is about 37. Suburban scores are labeled modeled. Full method and version history: /methodology.
Go deeper
Open data and dictionaryMethodologyInteractive risk mapFull 116-community leaderboard
Contact
Reporter questions are answered by email at [email protected]. Basement Risk Check is an independent Metro Detroit public-data project. Please attribute to Basement Risk Check.